
CGC - a datalog prototype for the Separate Compilation Assumption
cgc is a prototype tool that generates a sound call graph for the application part of a program without analyzing
the code of the library. It uses a context-insensitive pointer analysis to create the call graph on-the-fly.
Although the prototype is implemented in Datalog for ease of modification and experimentation, it could be
transcribed into Java to be embedded into an analysis framework such as
Soot or
Wala.
More details about cgc, its pointer analysis, assumptions, empirical evaluation can be found at my
ECOOP’12 paper.
Workflow
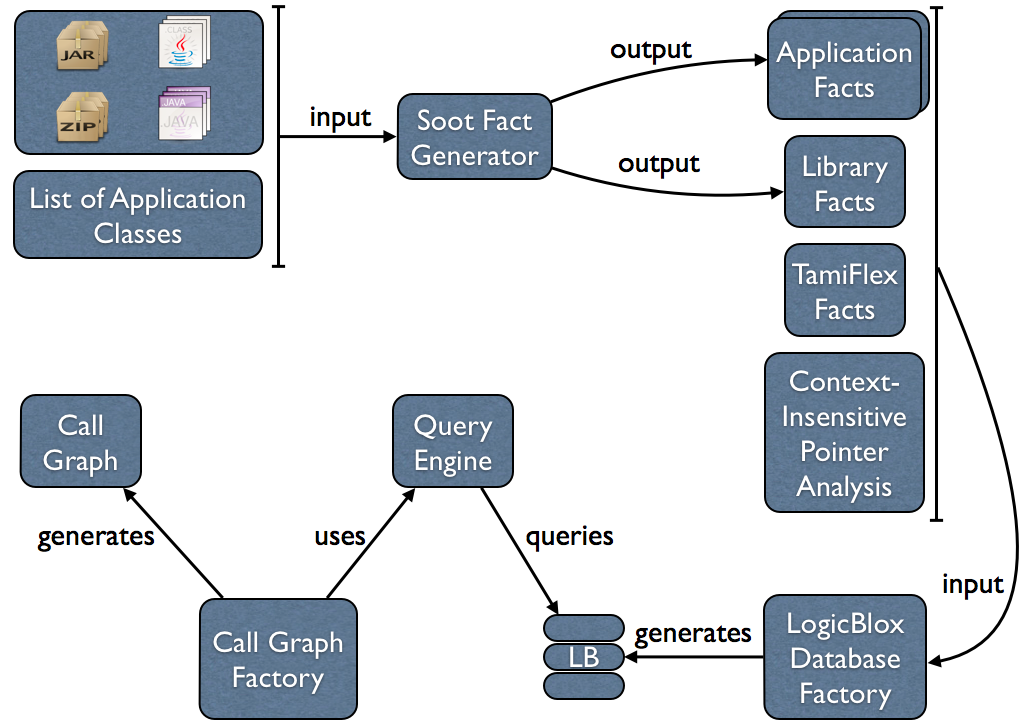
Call Graph Schema
cgc can output the generated call graph as a GXL document or a
directed DOT graph file. The DOT graph can
be visualized using Graphviz or converted by cgc to a PNG or a
PS file that can be visualized using any document previewer. The call graph GXL schema used by cgc can be found
here.
Logic Rules
cgc pointer analysis is implemented declaratively in Datalog. Datalog makes it easier to focus on “what” you want
from your analysis rather than focusing on “how” to do it. We used the context-insensitive pointer analysis from the
Doop framework as our base analysis and modified it,
greatly in many cases, to fit our requirements. The logic rules for cgc can be found
here. There is a README file in the downloaded archive that explains which files are taken as is from Doop, files completely new in cgc, and Doop files that are
used after modifying them.
Experiment Output
The output of the experiments used in the empirical evaluation found in my ECOOP’12 paper can be downloaded here. The download contains two folders, one for the DaCapo benchmarks and another one for the SPEC JVM98 benchmarks. Each benchmark program used has a folder that contains the following:
- <benchmark_name>.stats: a text file that contains all the output from the three tools run for each benchmark
program (
cgc, Spark, and Doop). It contains important information like preprocessing time, analysis time, etc. - callgraph/: a folder that contains all the call graphs generated by the three tools as well as the difference call graphs between them.
- database/: a folder that contains the LogicBlox database used by
cgcand Doop after the analysis finishes execution. - reflection.stats: a text file that contains statistical information about the use of reflection in the corresponding benchmark.